When it comes to your fertility journey, we are dedicated to maximizing results; providing our patients with every conceivable chance for success™.
We are proud of our results.
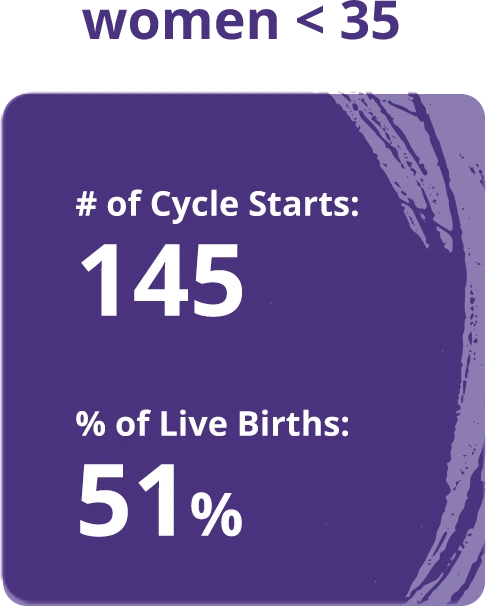
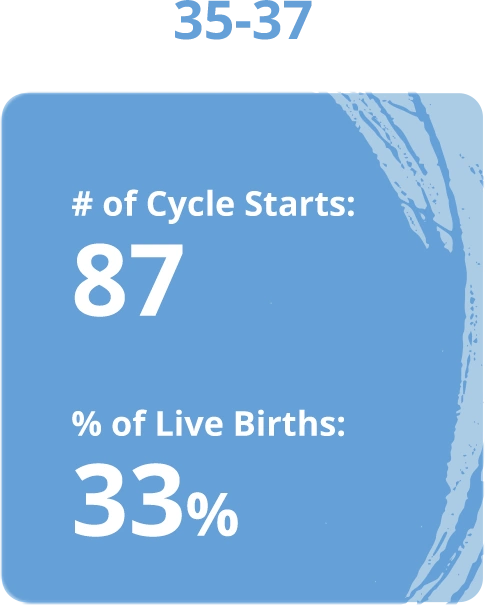
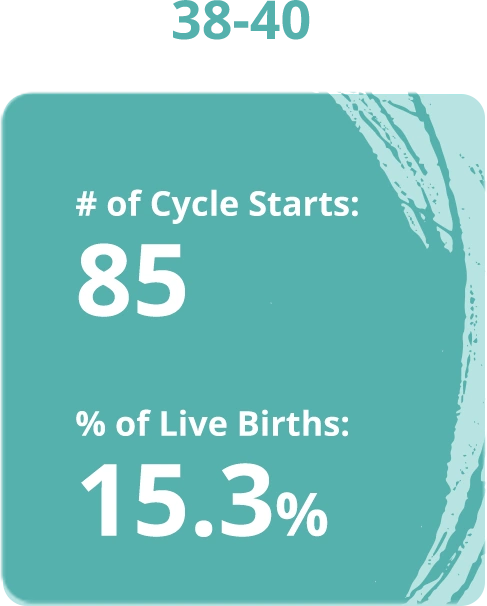
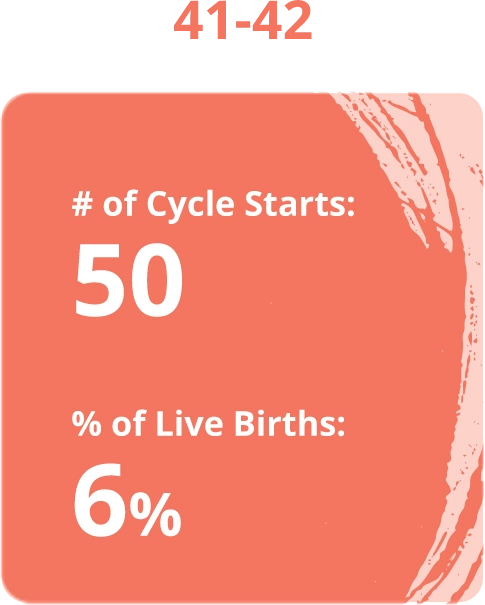
2020 Preliminary data as reported to the Society of Assisted Reprodive Technologies SART and the federal Centers for Disease Control and Prevention CDC.
Please note: A comparison of clinic success rates may not meaningful because patient medical characteristics, treatment approaches and entry criteria for SART may vary from clinic to clinic. Learn more about Reach's SART data.
At Reach Fertility, we believe in treating every patient like an individual and working together to customize a treatment plan that best fits each patient's needs. We welcome the hardest cases even if they adversely affect our outcomes, because we believe strongly that every patient deserves every opportunity.